First steps
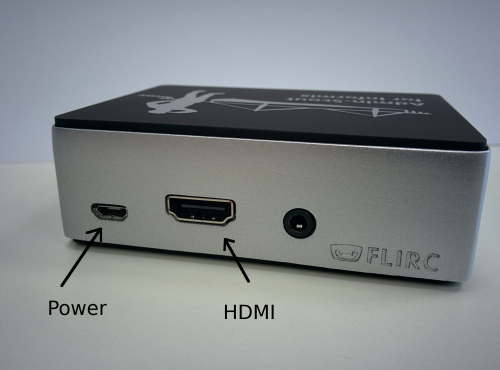
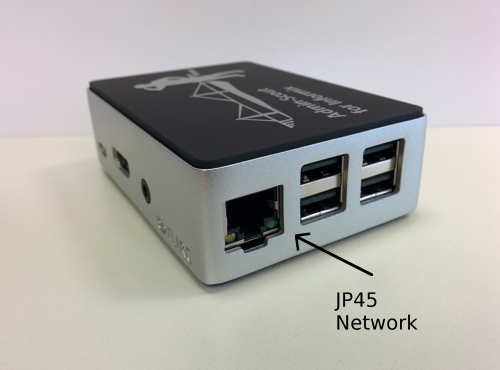
- Plugin the power adapter and the network cable (JP45) as shown in the pictures.
- Admin-Scout tries to find an existing DHCP-server in you network to register as "cursor-scout".
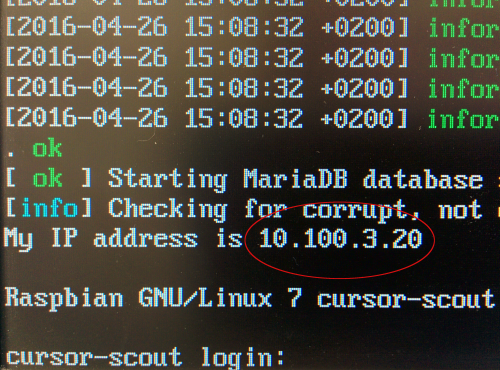
- The easiest way to find the ip-adress in your network is to plugin a monitor via hdmi - the ip-adress will be displayed at the login-screen.


Prerequisites:
- Open the following ports between the Admin-Scout and the database servers:
- Port 80 (http - from Informix-server->Admin-Scout - needed for the alarmprogram-plugin)
- Used database ports for the database-connection (ICC)
- Access via webbrowser to your Admin-Scout-ip
- Allow ping
- Access Admin-Scout to a smtp-server (mail)
- Optional - Internet access for updates and to NTP to adjust the internal system-time. Also possible to adjust the time manually in the settings.
First Login
- Open your web-browser from a PC/Mac with access to your Admin-Scout and type in the ip-adress (URL-Zeile http://<IP-adress-Admin-Scout>).
- authenticate as user "cursoradmin" with the initial password "scoutCUx15!"
- Choose "Configuration" in the menue
- setup you e-mail for sending alerts and reports.
You can separate different mail-recipients with a comma. - You can change your password for the "cursoradmin" (super-user) and/or for the user "openadmin" (user with less rights, just for monitoring in ICC)
After the change and refresh the field will be cleared - In addition, you can configure the proxy settings and the service levels for each instance, as well as the alarms that you would like to receive.
What's next
- Configuration: For detailled information about the configuration please refer to the chapter Configuration of the Admin-Scout.
- Time-Settings: Under the item Time settings / Service status, you can check whether the admin scout was able to set the time correctly using ntp. If this is not the case, you can set the date and time here.
- DB-Connections: If you have entered the necessary configuration data, the Open-Admin tool connection data can be set up. A connection is set up for each Informix instance to be monitored.
- From the left menu, select 'Manage Connections' and then 'Add Connections'.
- You can define a group i.e. for production and test
- If you have created your connections, a monitoring rule is automatically generated for each instance in the built-in Icinga 2.
- The server is monitored by ping, the connection to the database - by regularly trying to establish a connection and the retrieval of the alarm table from the sysadmin database. This table is filled by Informix's own and by sensors of the Admin-Scout. Icinga retrieves the content and sends it as an e-mail to the deposited e-mail address(es).
- In order to install the own Scout sensors, you need to connect to each instance in the Open-Admin tool.
- Under the menu point 'Scout Settings' you will find the entry 'Install Sensors'.
- Please install the sensors that you want to use. By default, all sensors are installed by clicking the 'Submit' button.
- The alarm program connection should be set up next. How this is done is described here.
- A good test for shipping is an onmode -l on the command line. The command switches to the next log file, which triggers an event 23 "Logical log 'number' complete". An e-mail message should be sent.
- Now we are ready to send the alarms generated by the internal sensors as well as the alarm events which trigger the alarm program via e-mail. By default, however, all alarms are sent, which is usually too much information. Especially the alarm program is also triggered at events, which have only informational character. Therefore, the mail per event can be configured. To do this, we need to go back to the Admin Scout configuration. Here, the events can be deselected per instance, which should not be reported by e-mail. Under the heading 'Set alarm configuration for server', you select an instance and set the hook for the events you do not want to be notified. We recommend doing this for events 18 "Log backup completed: log_number" and 23 "Logical log 'number' complete".
- Next, the scout sensors have to be configured. This is done via the threshold configuration of the individual sensors.
- To do this, go to the 'Task Scheduler' menu item in the Open Admin tool and 'Scheduler'.
- All tasks and sensors generated by the scout start with "cas_" to make them easier to distinguish from the Informix. Only some tasks require configuration.
- The first task is the "cas_check_dbspace_full" and the "cas_mon_dbspace_full". You can monitor the filling-level of the dbspaces. For both tasks, the parameter 'percent red' and 'percent yellow' can be set to the desired warning value. This is the default value for warnings. For a dbspace-exact setting, set the parameter "use_dbspace_check_params" to 1. The exact DBSpace-filling-level-setting can be adjust under 'Administration->Scout-Admin->Alert Configuration' - 'Server Storage->DBSpace freespace'. The settings of the other sensors are strongly dependent on the load of their database server and the way the application uses the database. We suggest that you collect the alarms that occur when the default parameters are exceeded in normal operation and then adjust the corresponding value for the task or sensor so that it is not exceeded during normal operation. The goal should be to avoid alarming when the server is running normally. Once this work has been done, the Admin Scout is fully set up and can effectively monitor its server.


